|
from pylab
import *
# Les valeurs
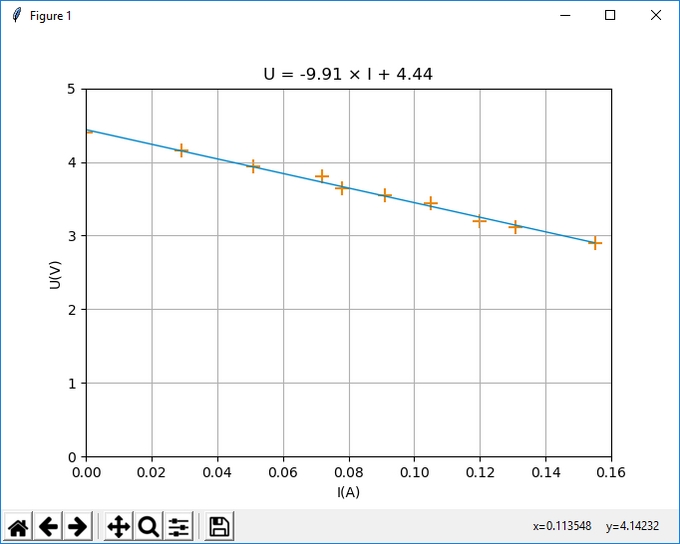
U = [4.40, 4.15,
3.94, 3.81, 3.64, 3.55, 3.44, 3.20, 3.11, 2.90]
I = [0, 0.029
,0.051 ,0.072 ,0.078 ,0.091, 0.105, 0.12, 0.131, 0.155]
# D'après la méthode des moindres carrés
Imoy = mean(I)
Umoy = mean(U)
varI = 0
for n
in range(0,len(I)
- 1):
varI += (I[n] - Imoy) ** 2
varI /=
len(I)
covarIU = 0
for n
in range(0,len(I)
- 1):
covarIU += (I[n] - Imoy) * (U[n] -
Umoy)
covarIU /= len(I)
a = covarIU / varI
b = Umoy - a * Imoy
# On trace
xlim(0, 0.16)
ylim(0, 5)
iL = [min(I),
max(I)]
uL = [a *
min(I) + b, a *
max(I) + b]
plot(iL, uL,
color = "#0088CC", linewidth =
1)
scatter(I, U, color =
"#EE8800", marker = "+",
s = 100)
xlabel("I(A)")
ylabel("U(V)")
monTitre =
"U = " +
str(round(a,2))
+ " × I"
if b < 0:
monTitre += " – "
else:
monTitre += " + "
monTitre
+= str(round(b,2))
title(monTitre)
# on ajoute
une grille
grid()
# on
affiche le graphe
show() |