|
from pylab
import *
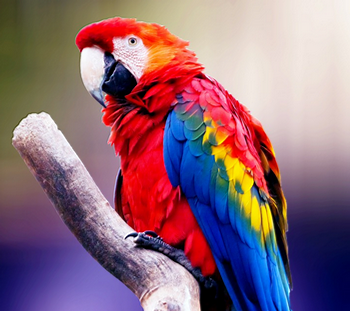
# On ouvre le fichier image
img = imread('C:\JVimages\perroquet.png')
# On crée un tableaux rempli de 1 qui a
la même dimension que l'image
imgT = ones(img.shape)
# Adapter ce paramètre à votre image
frontiere = 0.28
for i
in
range(1, img.shape[0]-1):
for j
in range(1, img.shape[1]-1):
test = False
for z in
range(0, 3):
if
abs(img[i-1, j, z] - img[i+1, j, z]) > frontiere: test =
True
if abs(img[i, j-1, z] -
img[i, j+1, z]) > frontiere: test =
True
if abs(img[i-1, j-1, z] -
img[i+1, j+1, z]) > frontiere: test =
True
if abs(img[i-1, j+1, z] -
img[i+1, j-1, z]) > frontiere: test =
True
if test is True:
imgT[i, j, 0] = 0
imgT[i, j, 1] = 0
imgT[i, j, 2] = 0
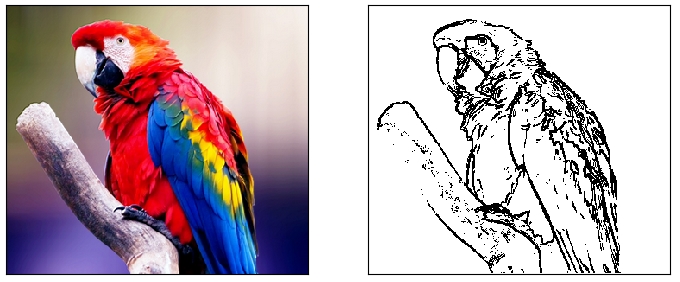
# Dans 2 cases,
on affiche l'image de départ et le dessin
# On cache les axes
xticks([]) et yticks([])
subplot(1, 2, 1)
xticks([])
yticks([])
imshow(img)
subplot(1, 2, 2)
xticks([])
yticks([])
imshow(imgT)
# On montre le résultat
show()
|


